#schoolofeconomics
The UK national debt is the total amount of money the British government owes to the private sector and other purchasers of UK gilts.
- In Nov 2018, UK public sector net debt was£1,7951.3 billion equivalent to 83.9% of GDP
- Source: [1. ONS public sector finances,- HF6X] (page updated 21 Jan 2019)
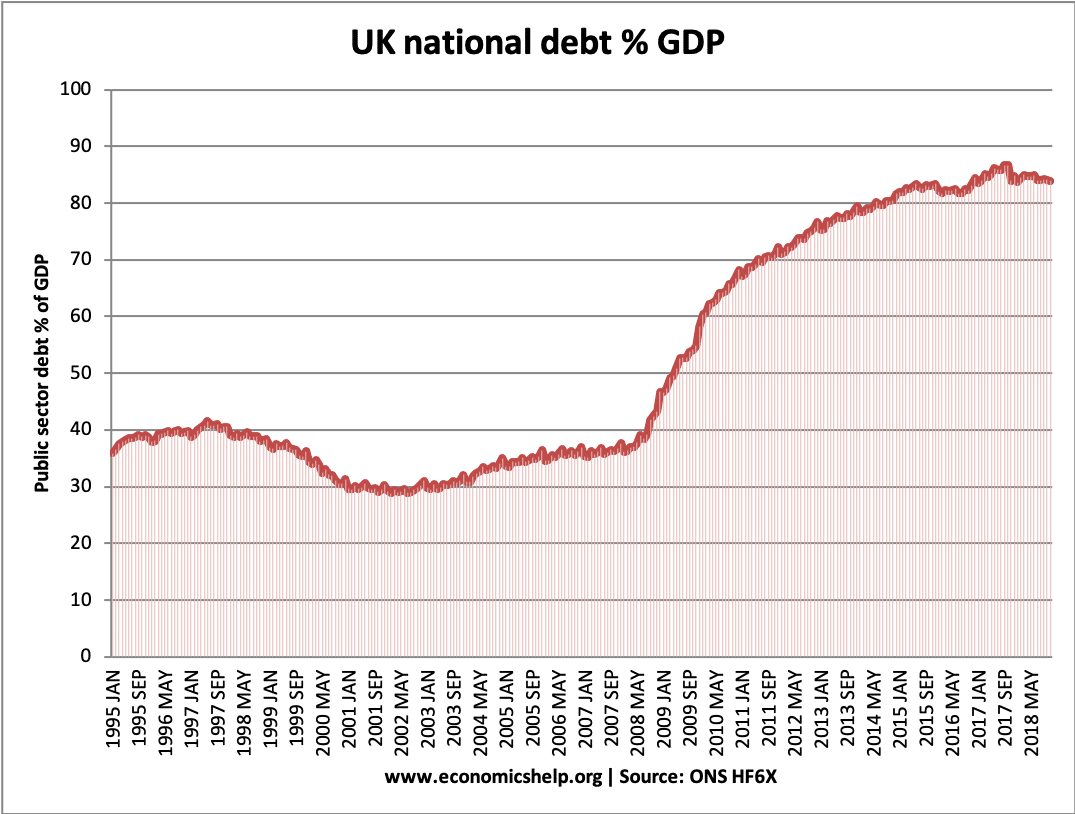
Source: ONS debt as % of GDP – HF6X | PUSF – public sector finances at ONS
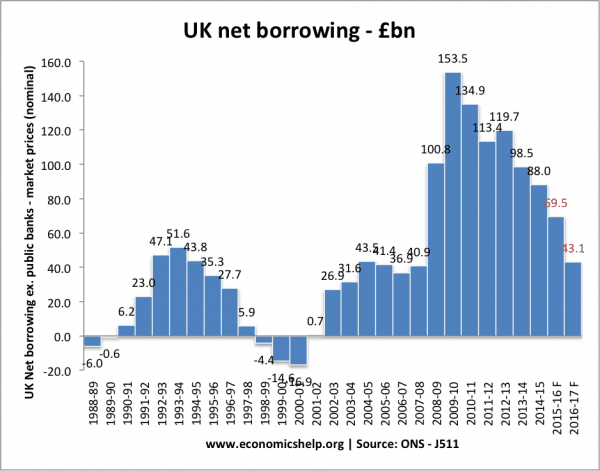
Budget deficit – annual borrowing
This is the amount the government has to borrow per year.
- In 2017-18 Net borrowing was £41.5 billion
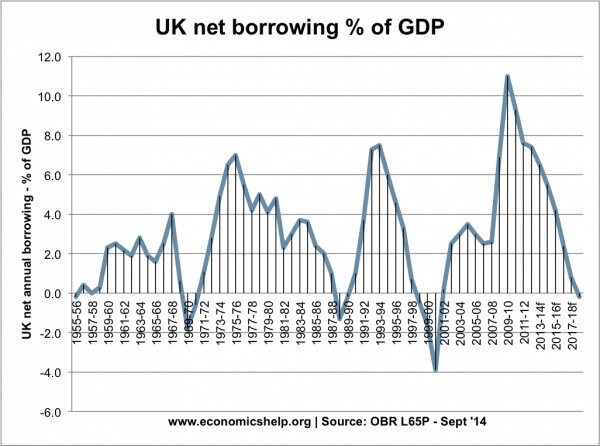
UK net borrowing
Latest statistics at OBR
UK net borrowing as % of GDP

Figures for 2014-15 onwards are forecasts. | View: Latest statistics at OBR
Further reading on
Deficit down but debt up?
One potential confusion is that politicians may say the budget deficit is coming down. But, at the same time, national debt is rising.
- If annual borrowing falls from £80bn to £50bn, the annual deficit is lower. But, at the same time, the national debt (total debt) can still be rising.
Debt as % of GDP
The most useful measure of national debt is to look at debt as a % of GDP. For example in 1950, UK national debt was £640bn (at 2005 prices) – but this was 250% of GDP.
Recent history of UK National Debt
- After a period of financial restraint, from mid 1990s, public sector debt as a % of GDP fell to 29% of GDP by 2002.
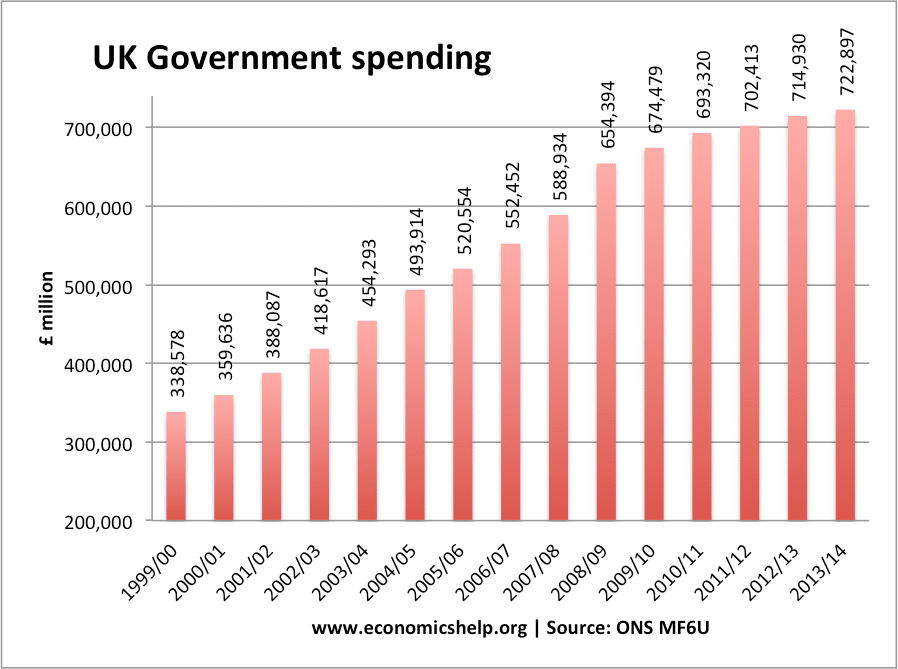
- From 2002 – 2007, national debt increased to 37% of GDP. This increase in debt levels occurred despite the long period of economic expansion; it was primarily due to the government’s decision to increase spending on health and education (see: Government spending in this period). There has also been a marked rise in social security spending.
2008-2015 – public sector debt has increased sharply because of:
- 2008-13 recession (lower tax receipts, higher spending on unemployment benefits) The recession particularly hit stamp duty (falling house prices) income tax and lower corporation tax.
- These cyclical factors have also exposed an underlying structural deficit. (deficit caused by spending greater than tax, ignoring cyclical factors)
- Financial bailout of Northern Rock, RBS, Lloyds and other banks.
- From 2011-2015, the pace of increase in the public sector debt has slowed due to the government attempts to reduce the budget deficit. The government has announced strict spending limits.
Comparison with other countries
Although 80% of GDP is high by recent UK standards, it is worth bearing in mind that other countries have a much bigger problem. Japan, for example, has a National debt of 225%, Italy is over 120%. The US national debt is close to 80% of GDP. [See other countries debt]. Also, the UK has had much higher national debt in the past, e.g. in the late 1940s, UK debt was over 200% of GDP.
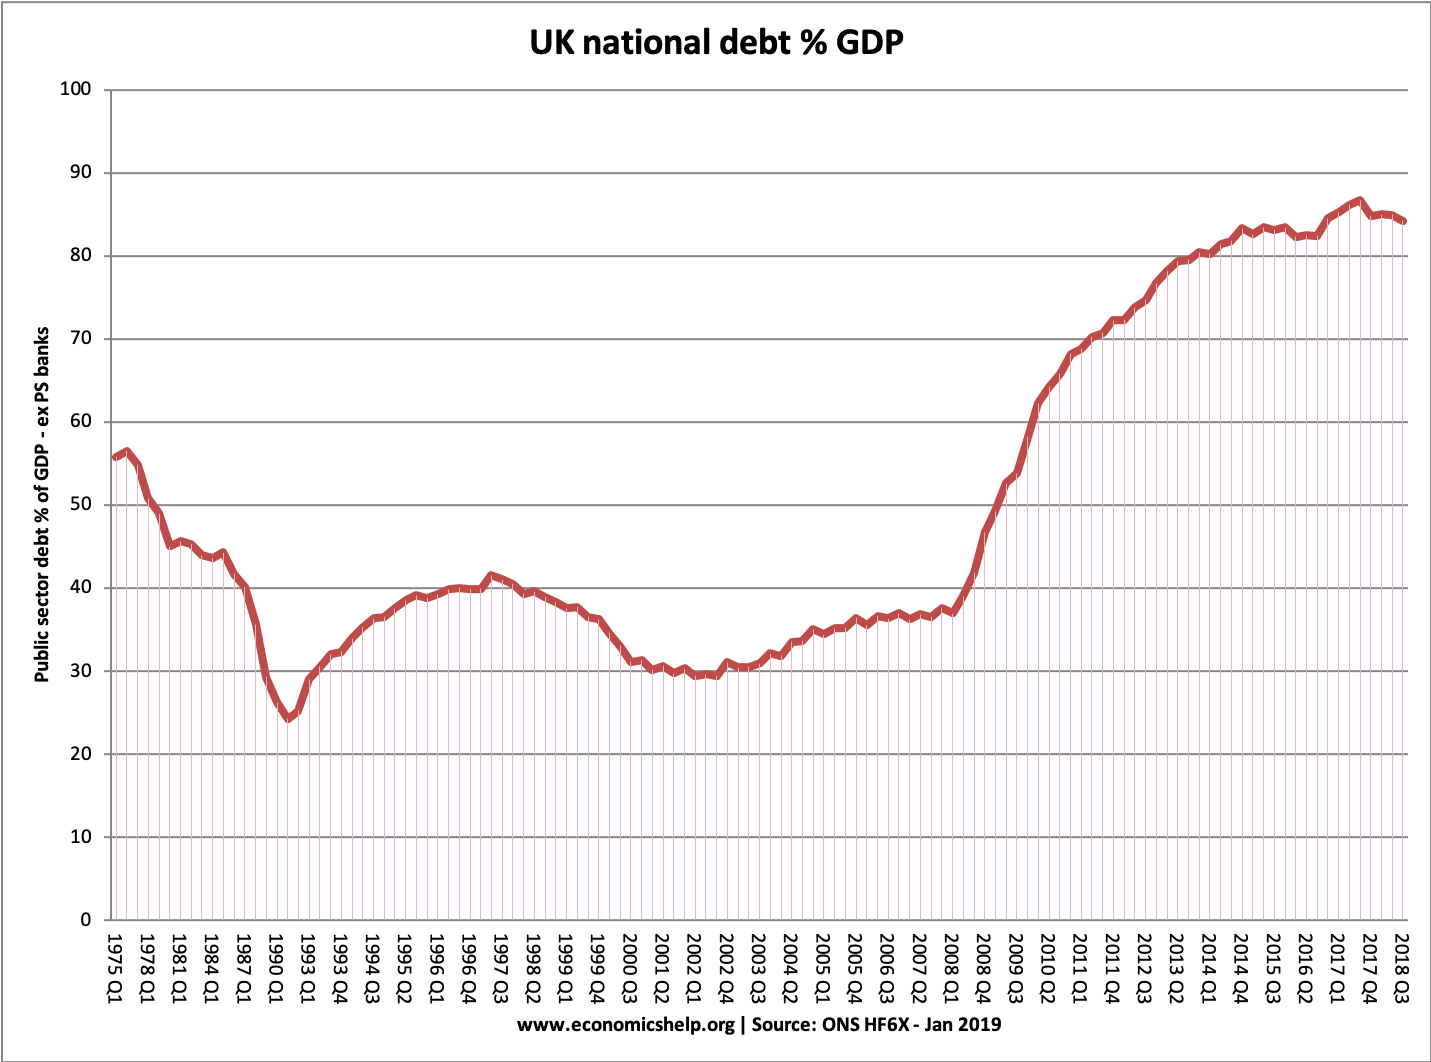
History of national debt
UK National Debt since 1900.
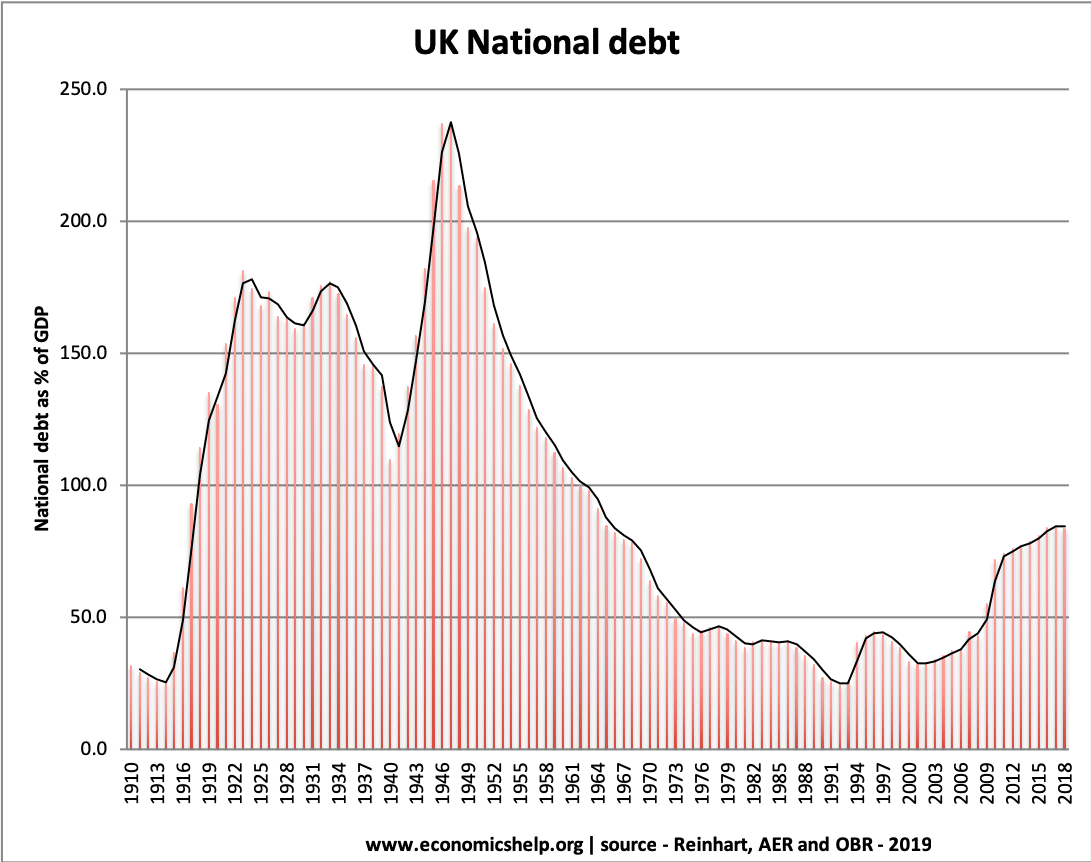
Source: Reinhart, Camen M. and Kenneth S. Rogoff, “From Financial Crash to Debt Crisis,” NBER Working Paper 15795, March 2010. and OBR from 2010.
See also: Historical National debt
These graphs show that government debt as a % of GDP has been much higher in the past. Notably in the aftermath of the two world wars. This suggests that current UK debt is manageable compared to the early 1950s. (note, even with a national debt of 200% of GDP in the 1950s, UK avoided default and even managed to set up the welfare state and NHS. In the current climate, the UK would struggle to borrow the same as in the past. For example, private sector saving is lower, and the US wouldn’t give us big loan like in the 1950s.
Debt reduction and growth
The post-war levels of national debt suggest that high debt levels are not incompatible with rising living standards and high economic growth.
The reduction in debt as a % of GDP 1950-1980 was primarily due to a prolonged period of economic growth.
- See: how the UK reduced debt in the post-war period
- This contrasts with the experience of the UK in the 1920s, when in the post First World War, the UK adopted austerity policies (and high exchange rate) but failed to reduce debt to GDP. Debt in Post-First World War period.
How much can a government borrow?
Historical budget deficit
Annual borrowing since 1950
Debt and bond yields
Bond yields reflect the cost of borrowing. Lower bond yields reduce the cost of government borrowing.
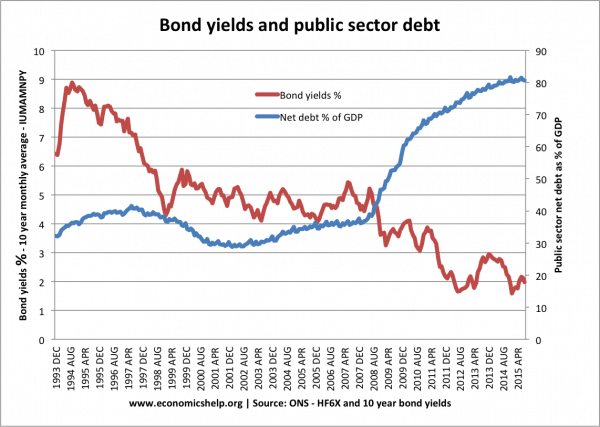
Since 2007, UK bond yields have fallen. Countries in the Eurozone with similar debt levels have seen a sharp rise in bond yields putting greater pressure on their government to cut spending quickly. However, being outside the Euro with an independent Central Bank (willing to act as lender of last resort to the government) means markets don’t fear a liquidity crisis in the UK; Euro members who don’t have a Central Bank willing to buy bonds during a liquidity crisis have been more at risk to rising bond yields and fears over government debt.
See also: Bond yields on European debt | (reasons for falling UK bond yields)
Cost of Interest Payments on National Debt
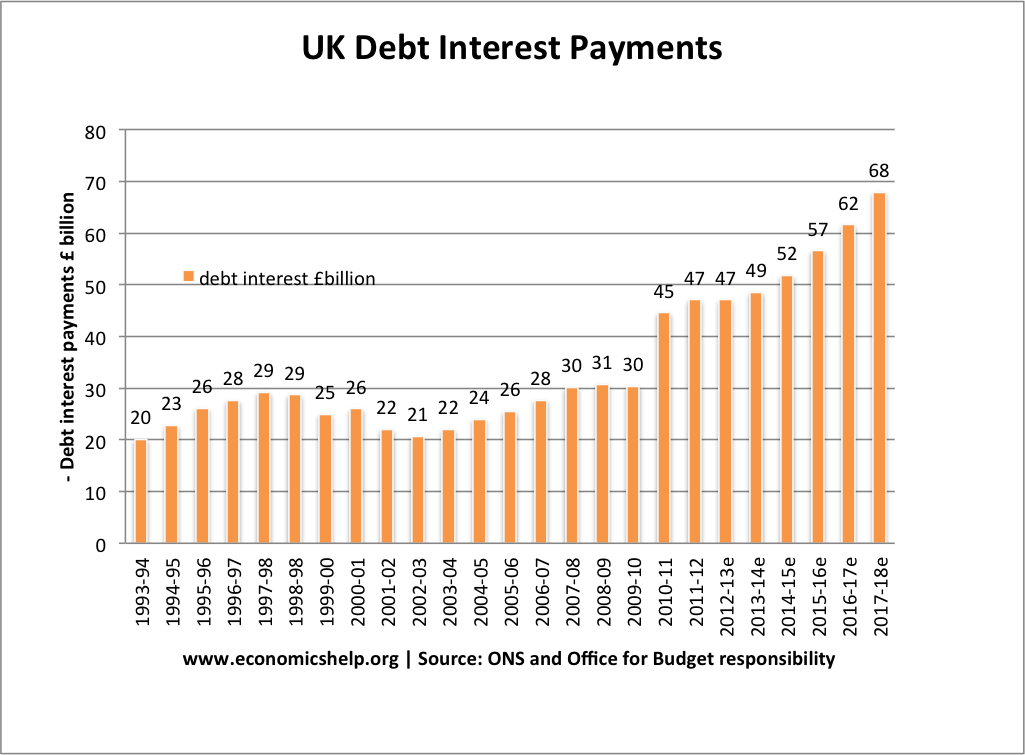
The cost of National debt is the interest the government has to pay on the bonds and gilts it sells. In 2011/12, the debt interest payments on UK debt are anticipated to be £48.6 bn (3% of GDP). This is a sharp increase from two years ago, but still quite manageable. See also: UK Debt interest payments
As a % of GDP, debt interest payments are relatively low.
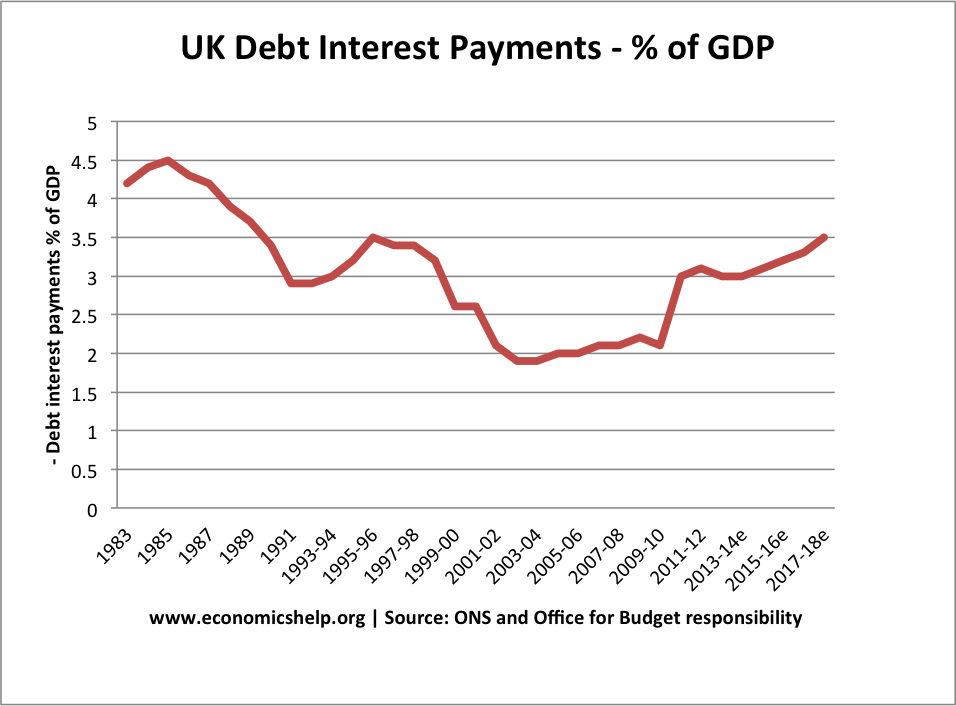
In 1985-86, debt interest payments reached 4.5% of GDP
How to reduce the debt to GDP ratio?
- Economic expansion which improves tax revenues and reduces spending on benefits like Job Seekers Allowance. The economic slowdown which has occurred since 2010 has pushed the UK into a period of slow economic growth – especially if we consider GDP per capita growth. Therefore the further squeeze on tax revenues has led to deficit reduction targets being missed.
- Government spending cuts and tax increases (e.g. VAT) which improve public finances and deal with the structural deficit. The difficulty is the extent to which these spending cuts could reduce economic growth and hamper attempts to improve tax revenues. Some economists feel the timing of deficit consolidation is very important, and growth should come before fiscal consolidation.
- See: practical solutions to reducing debt without harming growth
What will be the impact of Chancellor’s plan to run budget surpluses?
Is it a good idea to enshrine in law the idea of a government being forced to run a budget surplus?
What is the real level of UK national debt?
It is argued by some that the UK’s national debt is actually a lot higher. This is because national debt should include pension contributions and private finance initiatives PFI which the government are obliged to pay.
The Centre for Policy Studies (at end of 2008) argues that the real national debt is actually £1,340 billion, which is 103.5 percent of GDP. This figure includes all the public sector pension liabilities such as pensions, and private finance initiative contracts e.t.c (and Northern Rock liabilities).
- However, these pension liabilities are not things the government are actually spending now. Therefore, there is no need to borrow for them yet. It is more of a guide to future public sector debt. I don’t accept the fact that future pension liabilities should be counted as public sector debt. In 2006, the Statistics Office did change calculations to include some PFI into public sector debt figures [pdf – Treasury.gov.uk]
- However, it is a sign that it will be difficult to improve finances in the future.
Another problem is that with the financial crisis, the government have added an extra £500bn of potential liabilities. Note: the Government has offered to back mortgage securities. They are unlikely to spend this money. But, in theory, the government could be liable for extra debts of up to £500bn. If we include this bailout package as a contingent liability National debt would be well over 100% of GDP. However, with a modest improvement in the bank sector, the necessity for these bailouts look unlikely, unless there is a very sharp deterioration in global financial markets – which is always possible.
Forecast for National Debt
- Current forecasts for UK debt predict that the UK public sector debt to GDP ratio will peak at just over 80% in 2016-17. However, in the past few years, government forecasts have regularly been revised upwards due to poor growth and disappointing deficit reduction
- What are the prospects for UK debt default?
Potential problems of National Debt
- Interest payments. The cost of paying interest on the government’s debt is very high. In 2011 debt interest payments will be £48 billion a year (est 3% of GDP). Public sector debt interest payments will be the 4th highest department after social security, health and education. Debt interest payments could rise close to £70bn given the forecast rise in national debt.
- Higher taxes / lower spending in the future.
- Crowding out of private sector investment/spending.
- The structural deficit will only get worse as an ageing population places greater strain on the UK’s pension liabilities. (demographic time bomb)
- Potential negative impact on exchange rate (link)
- Potential of rising interest rates as markets become more reluctant to lend to the UK government.
However, Government Borrowing is not always as bad as people fear.
- Borrowing in a recession helps to offset a rise in private sector saving. Government borrowing helps maintain aggregate demand and prevents a fall in spending.
- In a liquidity trap and zero interest rates, governments can often borrow at very low rates for a long time (e.g. Japan and the UK) This is because people want to save and buy government bonds.
- Austerity measures (e.g. cutting spending and raising taxes) can lead to a decrease in economic growth and cause the deficit to remain the same % of GDP. Austerity measures and the economy | Timing of austerity
Who owns UK Debt?
The majority of UK debt used to be held by the UK private sector, in particular, UK insurance and pension funds. In recent years, the Bank of England has bought gilts taking its holding to 25% of UK public sector debt.
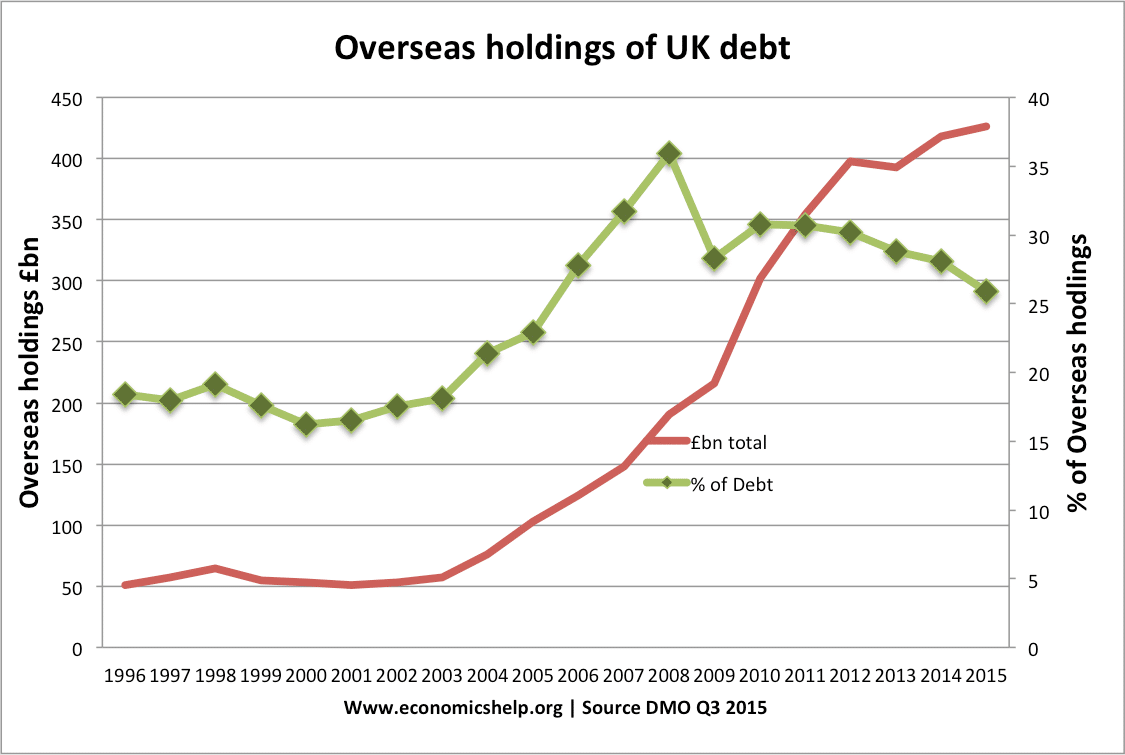
Overseas investors own about 25% of UK gilts (2016). See more at: Who does the UK own money to?

More at: who owns UK debt?
Total UK Debt – government + private
- Another way to examine UK debt is to look at both government debt and private debt combined.
- Total UK debt includes household sector debt, business sector debt, financial sector debt and government debt. This is over 500% of GDP.Total UK Debt
Private sector savings
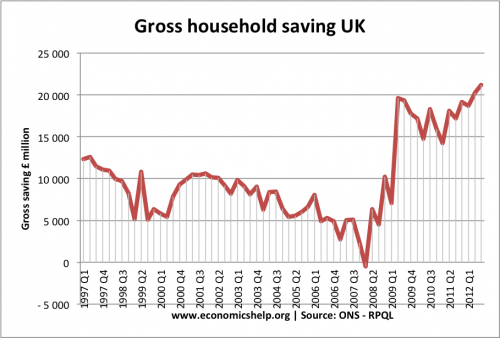
When considering government borrowing, it is important to place it in context. From 2007 to 2012, we have seen a sharp rise in private sector saving (UK savings ratio). The private sector has been seeking to reduce their debt levels and increase savings (e.g. buying government bonds). This increase in savings led to a sharp fall in private sector spending and investment. The increase in government borrowing is making use of this steep increase in private sector savings and helping to offset the fall in AD. see: Private and public sector borrowing
Government spending