C. P. Chandrasekhar and Jayati Ghosh
- March 28, 2019
The SDGs were obviously incredibly ambitious – far more so than the Millennium Development Goals that they succeeded – and so it was indeed a remarkable achievement that governments of almost all countries signed up to them. There were no less than 17 very significant and substantive goals, each containing multiple targets, and each target relying often on more than one indicator. And these goals and targets are not simply extrapolations of past trends (as several of the MDGs were). Rather, some of them present formidable challenges, since they require a reversal of the prior trends, such as reducing inequalities, or creating sustainable patterns of consumption and production and acting against climate change.
Also, it is only a few years since these goals were adopted by the international community, and therefore to expect significant progress on them already may be over-optimistic. Nevertheless, the direction and pace of change towards meeting these goals is important. South Asia (and particularly India) was something of a laggard in meeting the MDGs, other than those relating to income poverty – and if current trends are considered, the problems are even greater with respect to the SDGs. The most recent available data suggest that the regions is very far from being on track to achieve most goals, and in some cases and for certain goals, the direction of change is the opposite of what is required.
Performance on the SDGs is being measured by one effort that scores countries out of 100 (as the target or best possible outcome to be on track to meeting the SDGs) and currently Sweden performs best with a score of 85. Figure 1 shows that South Asian countries are well below that, with even the best performing of them (Bhutan) scoring below the global median of 66.2. Both performance and progress towards these goals appears to have little to do with levels of per capita income or degree of development. India, which is not only the largest and most diversified economy in the region but also prides itself on rapid income growth rates and hopes to emerge as a potential leader of the world economy, performs very poorly even in relation to other South Asian countries. Bhutan and Nepal – both landlocked countries at lower levels of development – show better ranks and significantly higher scores.
Table 1 indicates the progress by goals. The only goal for which all South Asian countries appear to be at either moderate or good levels and on track to meeting the goal is that of eliminating poverty. Even this may appear surprising, but it also has to do with the metrics used, with income poverty defined as living below $1.90 per day at PPP exchange rates as the indicator. This may be an approximation of absolute poverty, but the use of the PPP exchange rates can be questioned on several grounds; meanwhile, claims of moving to eliminate poverty altogether by 2030 are likely to ring hollow in many South Asian countries.
Figure 1: South Asia is performing poorly on meeting the SDGs
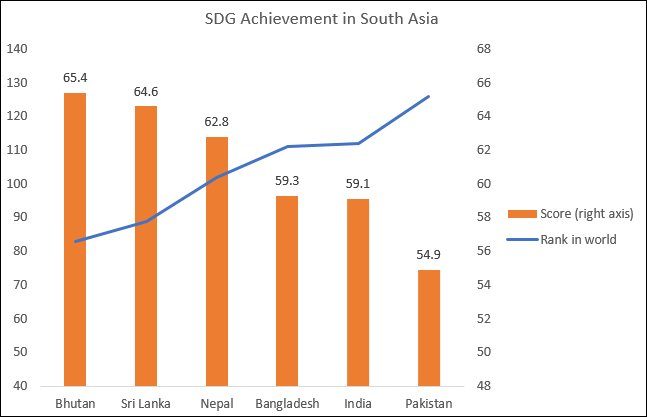
Source: SDG Index and Dashboards Report 2018
The bigger concern is that there is no other goal that South Asian countries are even on track to meet (other than Sri Lanka for Goals 6 and 8). Even for the goals for which the current performance is moderate and shows some improvement, the current rate of progress would be inadequate to meet the goal. And most countries show very high incidence of stagnant or no progress for many goals, and absolute deterioration – which implies moving away from the target – for others. Even the indicators that are shown as doing better can strain credibility to some extent, such as the claim that decent work conditions are improving or on track in some countries. Even with these somewhat optimistic assessments for some indictors, for the region as a whole, 14 of the 17 SDGs will be missed at the current rate of progress, around three-quarters of the targets will not be met, and for at least 12 of the targets, the current direction of change is negative.
What explains this overall poor performance, as well as the slightly better performance of some countries within this aggregate picture of South Asia? It could be that at least some of the answer lies in the goal for which all countries show “insufficient data” to allow for assessment: that of reducing inequalities. The absence of statistical indicators cannot blind us to the severely constraining role played by inequalities of income, power, access to services and citizen’s entitlements, which then play out in affecting the other goals in each country. This in turns highlights the significance of political processes and the orientation of governments: those governments that have been more explicitly concerned with reducing inequalities in practice (rather than simply paying lip-service to such a goal) have been more effective in ensuring better performance to several other goals and targets.
Despite the relatively low Gini coefficients of consumption inequality in South Asian countries, the region is actually one of the most unequal in the world, because of a complex and intersectional system of hierarchy and discrimination in which caste, ethnic and gender distinctions all play roles. Of these, caste differences (which interestingly exist across the region, and across different religions as well) may be the most significant in terms of how they influence opportunities for employment and income, affect access to housing, basic social services of health and education, and amenities like clean water and energy, as well as political voice. In other words, reduction of inequalities is not just a separate goal; it is a crucial underlying factor that affects the ability of a country to move towards in progress in achieving sustainable development in general.
Table 1: Level and progress towards goals by country
| Bhutan | Sri Lanka | Nepal | Bangladesh | India | Pakistan | ||
| 1 | No Poverty | Good,On track | Good,On track | Moderate, On track | Moderate, On track | Moderate, On track | Moderate, On track |
| 2 | Zero Hunger | Poor, improving | Poor, improving | Poor, improving | Moderately Poor, improving | Poor, improving | Poor, Improving |
| 3 | Good Health and Well being | Poor, improving | Poor, improving | Poor, improving | Moderately Poor, improving | Poor, improving | Poor, Stagnating |
| 4 | Quality Education | Moderate, maintaining | Poor, improving | Insufficient data | Insufficient data | Insufficient data | Poor, Stagnating |
| 5 | Gender Equality | Poor, improving | Poor, Stagnating | Poor, improving | Moderately Poor, Improving | Moderately Poor, Stagnating | Poor, Stagnating |
| 6 | Clean Water and Sanitation | Insufficient data | Good, On track | Insufficient data | Insufficient data | Poor, improving | Insufficient data |
| 7 | Affordable and Clean Energy | Insufficient data | Poor, Stagnating | Poor, improving | Moderately Poor, improving | Poor,Stagnating | Poor, improving |
| 8 | Decent Work and Economic Growth | Insufficient data | Good, On track | Poor, improving | Poor, Stagnating | Moderate, On track | Poor, improving |
| 9 | Industry Innovation and Infrastructure | Insufficient data | Poor, improving | Poor, improving | Moderately Poor, improving | Poor, improving | Poor, improving |
| 10 | Reduced Inequalities | Insufficient data | Insufficient data | Insufficient data | Insufficient data | Insufficient data | Insufficient data |
| 11 | Sustainable Cities and Communities | Insufficient data | Poor, Stagnating | Poor, Stagnating | Poor, Stagnating | Poor, Stagnating | Poor, Worsening |
| 12 | Responsible Consumption and Production | Insufficient data | Insufficient data | Insufficient data | Insufficient data | Insufficient data | Insufficient data |
| 13 | Climate Action | Good, Maintaining | Good, Maintaining | Moderate, stagnating | Poor, Stagnating | Poor, Stagnating | Moderate, stagnating |
| 14 | Life Below Water | Insufficient data | Poor, improving | Insufficient data | Poor, Stagnating | Poor, improving | Poor, Stagnating |
| 15 | Life on Land | Poor, maintaining | Poor, improving | Poor, Stagnating | Very Poor, worsening | Poor, Stagnating | Poor, Worsening |
| 16 | Peace Justice and Strong Institutions | Insufficient data | Poor, Worsening | Poor, Stagnating | Poor, stagnating | Poor, Stagnating | Poor, Stagnating |
| 17 | Partnerships for Goals | Poor, maintaining | Poor, Worsening | Poor, improving | Poor, stagnating | Poor, Stagnating | Insufficient data |
Source: SDG Index and Dashboards Report 2018
(This article was originally published in the Business Line on March 26, 2019.)